
本系列教程共十篇
- valaxy博客全局美化教程(一):分类、标签、归档三个页面的美化教程
- valaxy博客全局美化教程(二):首页公告栏美化,新增随机文章展示板块
- valaxy博客全局美化教程(三):给网页增加加载动画
- valaxy博客全局美化教程(四):增加图片预览功能
- valaxy博客全局美化教程(五):友链页面美化,修改了友链样式以及增加留言板
- valaxy博客全局美化教程(六):留言页面增加信封展开效果
- valaxy博客全局美化教程(七):新增网址导航页面
- valaxy博客全局美化教程(八):页脚倒计时、搜索问题修复
- valaxy博客全局美化教程(九):新增相册页面,支持使用webdav作为相册
- valaxy博客全局美化教程(十):修复构建结束的时候会卡住
最初部署
简介
简单介绍一下valaxy,Valaxy = V + Galaxy 旨在成为下一代静态博客框架,提供更好的热更新与用户加载体验、更强大更便捷的自定义开发可能性。附上开源地址valaxy
本系列教程使用的主题是Sakura主题,附上开源地址sakura
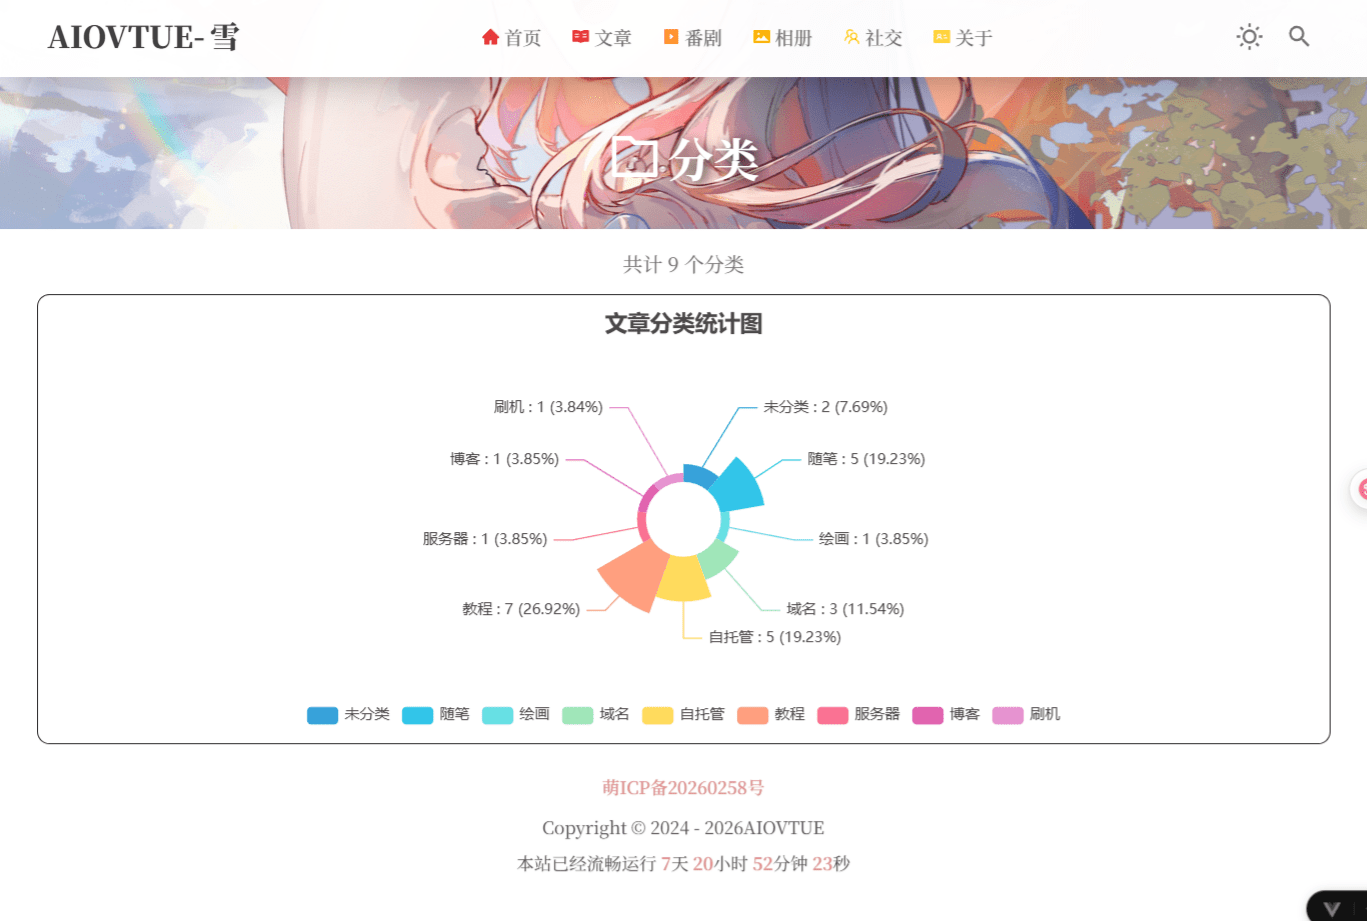
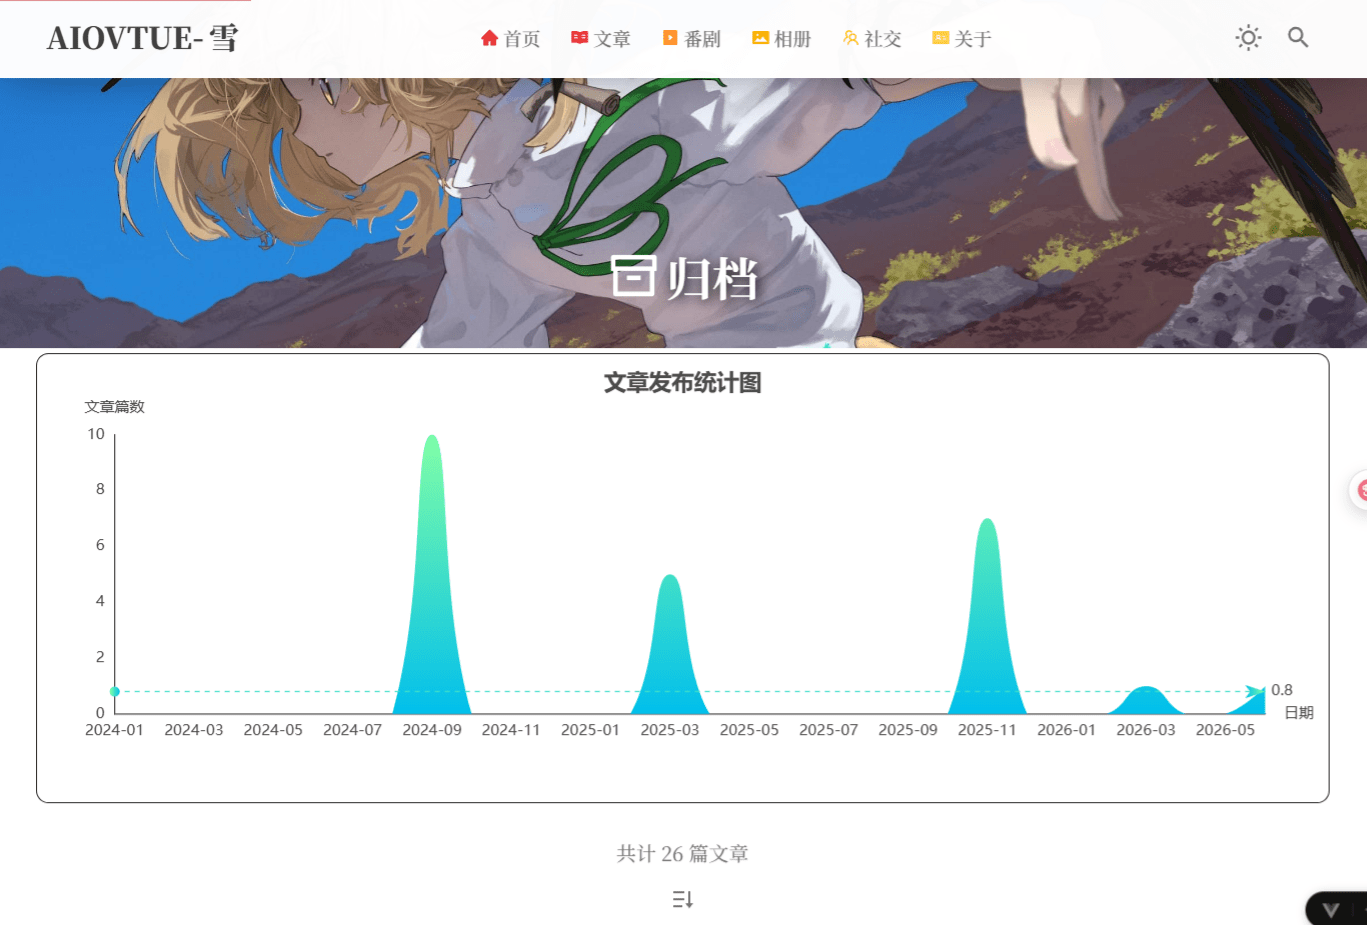
在开始教程之前先看一下最终的页面效果先:

开始部署
本教程基于windows端
-
选择一个合适的地方新建一个文件夹。
由于后期这个文件夹会变得非常大,所以建议一开始就选择合适的位置,推荐路径不要出现中文,虽然我弄下来没啥问题。
-
使用管理员身份打开powershell终端
虽然官方文档没要求必须管理员运行,但是我拉取文件的时候遇到一些问题,所有还是建议用一下。
-
在终端cd到你的文件夹
以防你不懂,加入你刚刚创建的文件夹路径是这个
C:\demo\demo,那么你只需要输入cd加上你的文件夹路径即可,示例:cd C:\demo\demo。 -
安装valaxy和主题
该操作基于电脑安装了
pnpm或npm的基础上,没安装的搜一下教程,或者看这个pnpm安装教程(主播也是百度找的~) 推荐安装pnpm,因为我用的这个,你们使用另一个的话后面可能会出一些奇奇怪怪的问题,毕竟我没用过 在刚刚的终端运行以下命令pnpm create valaxy,运行之后程序会开始创建流程 会经理一下过程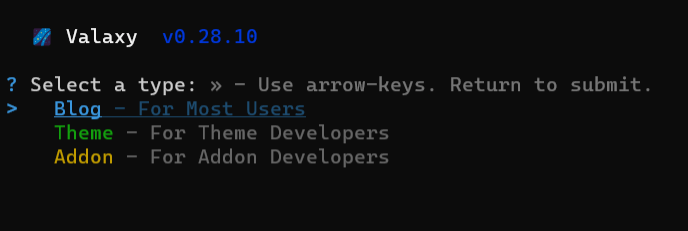 这个界面是问你用来干什么,选择第一个
blog作为博客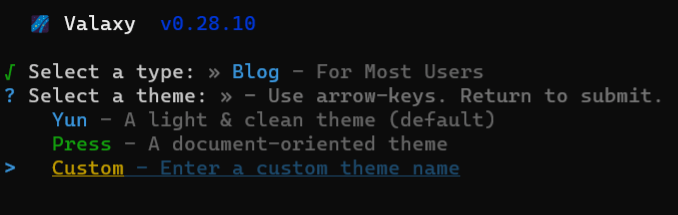 这是让你选择主题,我们选第三行
custom,这行的意思是自己输入主题名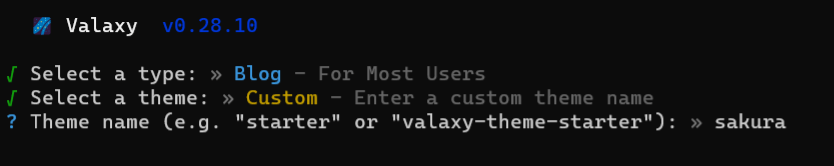 输入主题名
输入主题名sakura,本教程所有修改基于此主题,虽然没改主题文件,但是选其他主题可能会遇到奇奇怪怪的问题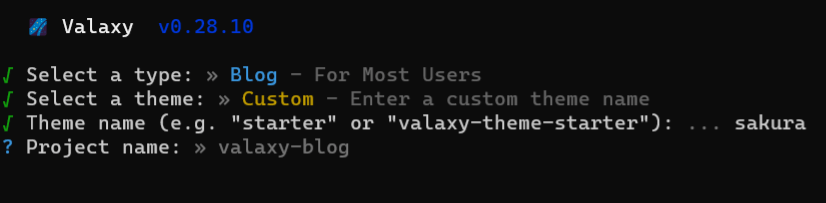 这是问你项目名称叫什么,就是文件夹名称,随便起一个英文就行
然后会问你是否运行,输入
这是问你项目名称叫什么,就是文件夹名称,随便起一个英文就行
然后会问你是否运行,输入y就行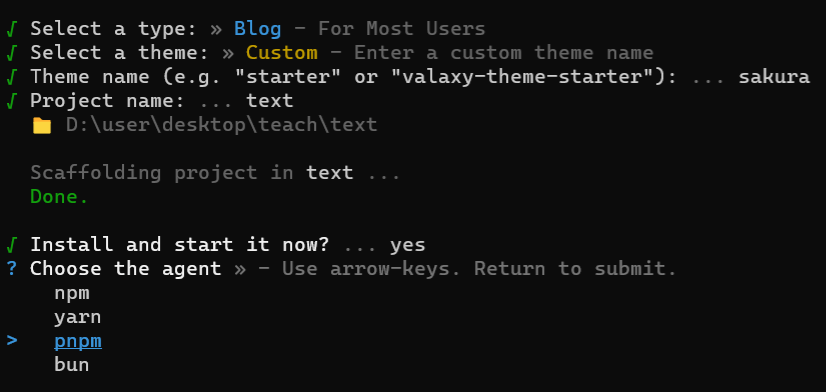 这里选择
这里选择pnpm即可开始自动安装 出现下面的界面就是安装完成了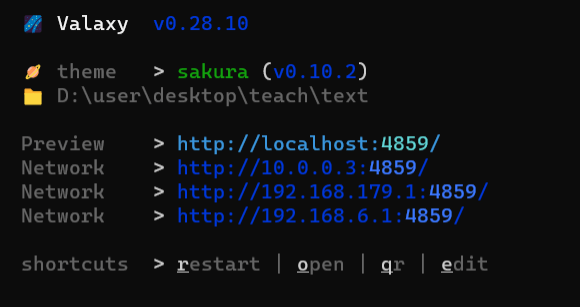 上面的链接就是你的网站,
ctrl+鼠标点击即可在浏览器打开链接,到此可以初步预览你的博客
开始美化
一共分为两大步,其中要增加六个文件,修改三个文件,由于大部分教程重复,只拿第一次出现的地方进行说明,后面忘记了回来看前面
分类页面
分类页面公新增两个文件,别漏了哦
新增文件
所谓新增文件的意思就是新增文件夹,哈哈哈,这里解释一下我的写法是什么意思,博客的目录类似于
项目根目录/
│
├─ .valaxy/
├─ .vscode/
├─ components/
├─ layouts/
├─ locales/
├─ node_modules/
├─ pages/
├─ public/
├─ styles/
│
├─ .dockerignore
├─ .editorconfig
├─ .gitignore
├─ .npmrc
├─ Dockerfile
├─ netlify.toml
├─ nginx.conf
├─ package.json
├─ pnpm-lock.yaml
├─ README.md
├─ site.config.ts
├─ tsconfig.json
├─ valaxy.config.ts
└─ vercel.json这个就是你刚才创建的文件夹,拉取valaxy博客之后的文件夹目录,我写的路径是基于此根目录的,举个例子,下方的\components\SakuraCategoriesChart.vue文件的意思就是,在文件夹components内部,新建一个名为SakuraCategoriesChart.vue的文件(windows创建这种文件的办法是右键,新建文本文档,然后把文件名连同后缀更改为这个即可),接着将文件下方的代码<script lang="ts" setup> .........复制到文件内即可,后续类似的新建文件按照同样的步骤,根据上方的文件夹路径和文件夹名称创建文件在写入内容即可。
新增\components\SakuraCategoriesChart.vue
<script lang="ts" setup>
import type { Categories, CategoryList } from 'valaxy'
import { isCategoryList, useAppStore } from 'valaxy'
import { computed, onMounted, onUnmounted, ref, watch } from 'vue'
import { useI18n } from 'vue-i18n'
import { useRouter } from 'vue-router'
import { loadEcharts, observeChartResize, type EChartsInstance } from '../utils/echarts'

interface ChartDataItem {
  name: string
  value: number
  categoryKey: string
  children?: ChartDataItem[]
}

interface ChartClickParams {
  data?: {
    categoryKey?: string
  }
}

const props = defineProps<{
  categories: Categories
}>()

const { t } = useI18n()
const router = useRouter()
const appStore = useAppStore()
const chartRef = ref<HTMLElement>()
let chartInstance: EChartsInstance | null = null
let stopObserveResize: (() => void) | undefined

const textColor = computed(() =>
  appStore.isDark ? 'rgba(255,255,255,0.7)' : '#4c4948',
)

function getCategoryName(name: string) {
  return name === 'Uncategorized' ? t('category.uncategorized') : name
}

function hasNestedCategories(categories: Categories) {
  for (const category of categories.values()) {
    if (!isCategoryList(category))
      continue
    for (const child of category.children.values()) {
      if (isCategoryList(child))
        return true
    }
  }
  return false
}

function buildFlatData(categories: Categories): ChartDataItem[] {
  const data: ChartDataItem[] = []
  for (const category of categories.values()) {
    if (!isCategoryList(category))
      continue
    data.push({
      name: getCategoryName(category.name),
      value: category.total,
      categoryKey: category.name,
    })
  }
  return data
}

function buildTreeNode(category: CategoryList, parentKey = ''): ChartDataItem {
  const categoryKey = parentKey ? `${parentKey}/${category.name}` : category.name
  const node: ChartDataItem = {
    name: getCategoryName(category.name),
    value: category.total,
    categoryKey,
  }

  const children: ChartDataItem[] = []
  for (const child of category.children.values()) {
    if (isCategoryList(child))
      children.push(buildTreeNode(child, categoryKey))
  }

  if (children.length > 0)
    node.children = children

  return node
}

function buildTreeData(categories: Categories) {
  return Array.from(categories.values())
    .filter(isCategoryList)
    .map(category => buildTreeNode(category))
}

function buildChartOption(hasParentCategory: boolean) {
  const flatData = buildFlatData(props.categories)
  const treeData = buildTreeData(props.categories)
  const color = textColor.value

  const option: Record<string, unknown> = {
    title: {
      text: '文章分类统计图',
      x: 'center',
      textStyle: { color },
    },
    legend: {
      top: 'bottom',
      data: flatData.map(item => item.name),
      textStyle: { color },
    },
    tooltip: {
      trigger: 'item',
      formatter: '{b} : {c}篇 ({d}%)',
    },
    series: [],
  }

  if (hasParentCategory) {
    ;(option.series as unknown[]).push({
      nodeClick: false,
      name: '文章篇数',
      type: 'sunburst',
      radius: ['15%', '90%'],
      center: ['50%', '55%'],
      sort: 'desc',
      data: treeData,
      itemStyle: {
        borderColor: '#fff',
        borderWidth: 2,
        emphasis: {
          focus: 'ancestor',
          shadowBlur: 10,
          shadowOffsetX: 0,
          shadowColor: 'rgba(255, 255, 255, 0.5)',
        },
      },
    })
  }
  else {
    ;(option.series as unknown[]).push({
      name: '文章篇数',
      type: 'pie',
      radius: [30, 80],
      roseType: 'area',
      label: {
        color,
        formatter: '{b} : {c} ({d}%)',
      },
      data: flatData,
      itemStyle: {
        emphasis: {
          shadowBlur: 10,
          shadowOffsetX: 0,
          shadowColor: 'rgba(255, 255, 255, 0.5)',
        },
      },
    })
  }

  return option
}

function renderChart() {
  if (!chartInstance || !chartRef.value)
    return

  const hasParentCategory = hasNestedCategories(props.categories)
  chartInstance.setOption(buildChartOption(hasParentCategory), true)
}

function handleChartResize() {
  chartInstance?.resize()
}

async function initChart() {
  if (!chartRef.value)
    return

  const echarts = await loadEcharts()
  chartInstance = echarts.init(chartRef.value, 'light')
  renderChart()
  chartInstance.resize()

  chartInstance.on('click', 'series', (event: ChartClickParams) => {
    if (event.data?.categoryKey) {
      router.push({
        query: { category: event.data.categoryKey },
      })
    }
  })

  stopObserveResize = observeChartResize(chartRef.value, handleChartResize)
}

const categorySignature = computed(() =>
  Array.from(props.categories.entries())
    .map(([key, value]) => (isCategoryList(value) ? `${key}:${value.total}` : key))
    .join('|'),
)

watch(categorySignature, renderChart)
watch(textColor, renderChart)

onMounted(() => {
  initChart()
})

onUnmounted(() => {
  stopObserveResize?.()
  chartInstance?.dispose()
  chartInstance = null
})
</script>

<template>
  <div
    id="categories-chart"
    ref="chartRef"
    class="sakura-stat-chart sakura-categories-chart"
    data-parent="true"
  />
</template>

<style lang="scss" scoped>
.sakura-categories-chart {
  display: block;
  height: 360px;
  padding: 10px;
  margin-bottom: 1rem;
}
</style>
这里就是第二个文件啦,我就赘述了,要看清楚路径哦~
新增components\layouts\SakuraCategoriesLayout.vue
<script lang="ts" setup>
import { useCategories, useConfig, useSiteStore } from 'valaxy'
import { computed } from 'vue'
import { useI18n } from 'vue-i18n'
import { useRoute } from 'vue-router'

type CategoriesStyle = 'list' | 'chart'

interface CategoriesThemeConfig {
  style?: CategoriesStyle
}

const site = useSiteStore()
const config = useConfig()

const { t } = useI18n()
const route = useRoute()
const curCategory = computed(() => (route.query.category || '') as string)
const categories = useCategories()

const categoryStyle = computed(() => {
  const themeConfig = config.value?.themeConfig as { categories?: CategoriesThemeConfig } | undefined
  return themeConfig?.categories?.style ?? 'list'
})

const posts = computed(() => {
  const list = site.postList.filter((post) => {
    if (post.categories && curCategory.value !== 'Uncategorized') {
      if (typeof post.categories === 'string')
        return post.categories === curCategory.value
      else
        return post.categories.join('/').startsWith(curCategory.value) && post.categories[0] === curCategory.value.split('/')[0]
    }
    if (!post.categories && curCategory.value === 'Uncategorized')
      return post.categories === undefined
    return false
  })
  return list
})
</script>

<template>
  <SakuraPage class="sakura-categories-page">
    <RouterView v-slot="{ Component }">
      <component :is="Component">
        <template #main-content>
          <slot name="content">
            <div>
              <div text="center" class="yun-text-light" p="2">
                {{ t('counter.categories', Array.from(categories.children).length) }}
              </div>

              <SakuraCategoriesChart
                v-if="categoryStyle === 'chart'"
                :categories="categories.children"
              />
              <SakuraCategories
                v-else
                :categories="categories.children"
              />
            </div>
          </slot>
        </template>

        <template #main-nav-before>
          <slot name="posts">
            <div v-if="curCategory">
              <SakuraPostList w="full" :posts />
            </div>
          </slot>
        </template>
      </component>
    </RouterView>
  </SakuraPage>
</template>

<style lang="scss">
.sakura-categories-page {
  .sakura-triple-columns {
    width: 100%;
  }
}
</style>
归档页面
现在开始是归档页面新增文件,这部分新增文件2个,别漏了哦
新增文件
新增components\SakuraArchivesChart.vue
<script lang="ts" setup>
import type { Post } from 'valaxy'
import { useAppStore } from 'valaxy'
import { computed, onMounted, onUnmounted, ref, watch } from 'vue'
import { useRouter } from 'vue-router'
import { createGradient, loadEcharts, observeChartResize, type EChartsInstance } from '../utils/echarts'

const props = withDefaults(defineProps<{
  posts: Post[]
  startMonth?: string
}>(), {
  startMonth: '2020-01',
})

const router = useRouter()
const appStore = useAppStore()
const chartRef = ref<HTMLElement>()
let chartInstance: EChartsInstance | null = null
let echartsLib: NonNullable<Window['echarts']> | null = null
let stopObserveResize: (() => void) | undefined

const textColor = computed(() =>
  appStore.isDark ? 'rgba(255,255,255,0.7)' : '#4c4948',
)

function generateMonthArray(startMonth: string) {
  const [startYear, startMon] = startMonth.split('-').map(Number)
  const now = new Date()
  const endYear = now.getFullYear()
  const endMon = now.getMonth() + 1

  const months: string[] = []
  let year = startYear
  let month = startMon

  while (year < endYear || (year === endYear && month <= endMon)) {
    months.push(`${year}-${String(month).padStart(2, '0')}`)
    month += 1
    if (month > 12) {
      month = 1
      year += 1
    }
  }

  return months
}

function getPostMonth(post: Post) {
  if (!post.date)
    return null
  if (post.hide && post.hide !== 'index')
    return null

  const date = post.date instanceof Date ? post.date : new Date(post.date)
  if (Number.isNaN(date.getTime()))
    return null

  return `${date.getFullYear()}-${String(date.getMonth() + 1).padStart(2, '0')}`
}

function countPostsByMonth(posts: Post[], monthArr: string[]) {
  const monthMap = new Map(monthArr.map(month => [month, 0]))

  posts.forEach((post) => {
    const month = getPostMonth(post)
    if (month && monthMap.has(month))
      monthMap.set(month, (monthMap.get(month) || 0) + 1)
  })

  return monthArr.map(month => monthMap.get(month) || 0)
}

const monthArr = computed(() => generateMonthArray(props.startMonth))
const monthValueArr = computed(() => countPostsByMonth(props.posts, monthArr.value))

const chartSignature = computed(() =>
  `${props.startMonth}|${monthArr.value.at(-1)}|${monthValueArr.value.join(',')}`,
)

function buildChartOption() {
  const color = textColor.value
  const gradient = echartsLib ? createGradient(echartsLib) : 'rgba(128, 255, 165)'

  return {
    title: {
      text: '文章发布统计图',
      x: 'center',
      textStyle: { color },
    },
    grid: {
      left: '3%',
      right: '4%',
      bottom: '12%',
      top: '16%',
      containLabel: true,
    },
    tooltip: {
      trigger: 'axis',
      formatter: '{b}<br/>文章篇数: {c}',
    },
    xAxis: {
      name: '日期',
      type: 'category',
      boundaryGap: false,
      nameTextStyle: { color },
      axisTick: { show: false },
      axisLabel: { show: true, color },
      axisLine: {
        show: true,
        lineStyle: { color },
      },
      data: monthArr.value,
    },
    yAxis: {
      name: '文章篇数',
      type: 'value',
      nameTextStyle: { color },
      splitLine: { show: false },
      axisTick: { show: false },
      axisLabel: { show: true, color },
      axisLine: {
        show: true,
        lineStyle: { color },
      },
    },
    series: [{
      name: '文章篇数',
      type: 'line',
      smooth: true,
      lineStyle: { width: 0 },
      showSymbol: false,
      itemStyle: {
        opacity: 1,
        color: gradient,
      },
      areaStyle: {
        opacity: 1,
        color: gradient,
      },
      data: monthValueArr.value,
      markLine: {
        data: [{
          name: '平均值',
          type: 'average',
          label: { color },
        }],
      },
    }],
  }
}

function renderChart() {
  if (!chartInstance)
    return

  chartInstance.setOption(buildChartOption(), true)
}

async function initChart() {
  if (!chartRef.value)
    return

  echartsLib = await loadEcharts()
  chartInstance = echartsLib.init(chartRef.value, 'light')
  renderChart()
  chartInstance.resize()

  chartInstance.on('click', 'series', (event) => {
    if (event.componentType !== 'series' || typeof event.name !== 'string')
      return

    const [year] = event.name.split('-')
    router.push({
      path: '/archives',
      hash: `##archive-year-${year}`,
    })
  })

  stopObserveResize = observeChartResize(chartRef.value, () => {
    chartInstance?.resize()
  })
}

watch(chartSignature, renderChart)
watch(textColor, renderChart)

onMounted(() => {
  initChart()
})

onUnmounted(() => {
  stopObserveResize?.()
  chartInstance?.dispose()
  chartInstance = null
  echartsLib = null
})
</script>

<template>
  <div
    id="posts-chart"
    ref="chartRef"
    class="sakura-stat-chart sakura-archives-chart"
    :data-start="startMonth"
  />
</template>

<style lang="scss" scoped>
.sakura-archives-chart {
  display: block;
  height: 360px;
  padding: 10px;
  margin-bottom: 1rem;
}
</style>
这是第二个哦~
新增components\layouts\SakuraArchivesLayout.vue
<script lang="ts" setup>
import { useConfig, useSiteStore } from 'valaxy'
import { computed } from 'vue'

type ArchivesStyle = 'list' | 'chart'

interface ArchivesThemeConfig {
  style?: ArchivesStyle
  startMonth?: string
}

const site = useSiteStore()
const config = useConfig()

const archiveStyle = computed(() => {
  const themeConfig = config.value?.themeConfig as { archives?: ArchivesThemeConfig } | undefined
  return themeConfig?.archives?.style ?? 'list'
})

const startMonth = computed(() => {
  const themeConfig = config.value?.themeConfig as { archives?: ArchivesThemeConfig } | undefined
  return themeConfig?.archives?.startMonth ?? '2020-01'
})
</script>

<template>
  <SakuraPage class="sakura-archivers-page">
    <RouterView v-slot="{ Component }">
      <component :is="Component">
        <template #main-content>
          <slot name="content">
            <div v-if="archiveStyle === 'chart'" class="sakura-archives-chart-section">
              <SakuraArchivesChart
                :posts="site.postList"
                :start-month="startMonth"
              />
              <SakuraTimeLine :posts="site.postList" />
            </div>
            <SakuraTimeLine v-else :posts="site.postList" />
          </slot>
        </template>
      </component>
    </RouterView>
  </SakuraPage>
</template>

<style lang="scss">
.sakura-archivers-page {
  .sakura-one-columns,
  .sakura-triple-columns {
    width: 100%;
  }

  .sakura-page-content {
    width: 100%;
    max-width: none;
  }

  main {
    width: 100%;
  }

  .sakura-archives-chart-section {
    width: 100%;
    overflow: visible;
  }
}
</style>
标签页面
现在开始标签页面新增文件,该部分新增文件2个,别漏了哦~
新增文件
新增 components\SakuraTagsChart.vue
<script lang="ts" setup>
import { useAppStore, useTags } from 'valaxy'
import { computed, onMounted, onUnmounted, ref, watch } from 'vue'
import { useRouter } from 'vue-router'
import { createGradient, loadEcharts, observeChartResize, type EChartsInstance } from '../utils/echarts'

interface TagDataItem {
  name: string
  value: number
  tagKey: string
}

const props = withDefaults(defineProps<{
  displayLength?: number
}>(), {
  displayLength: 10,
})

const tags = useTags()
const router = useRouter()
const appStore = useAppStore()
const chartRef = ref<HTMLElement>()
let chartInstance: EChartsInstance | null = null
let echartsLib: NonNullable<Window['echarts']> | null = null
let stopObserveResize: (() => void) | undefined

const textColor = computed(() =>
  appStore.isDark ? 'rgba(255,255,255,0.7)' : '#4c4948',
)

const displayData = computed(() => {
  const tagArr: TagDataItem[] = Array.from(tags.value.entries()).map(([key, tag]) => ({
    name: key,
    value: tag.count,
    tagKey: key,
  }))

  tagArr.sort((a, b) => b.value - a.value)
  return tagArr.slice(0, Math.min(tagArr.length, props.displayLength))
})

const chartSignature = computed(() =>
  displayData.value.map(item => `${item.tagKey}:${item.value}`).join('|'),
)

function buildChartOption() {
  const color = textColor.value
  const data = displayData.value
  const gradient = echartsLib ? createGradient(echartsLib) : 'rgba(128, 255, 165)'
  const emphasisGradient = echartsLib
    ? createGradient(echartsLib, 'rgba(128, 255, 195)', 'rgba(1, 211, 255)')
    : 'rgba(128, 255, 195)'

  const option: Record<string, unknown> = {
    title: {
      text: data.length ? `Top ${data.length} 标签统计图` : '标签统计图',
      x: 'center',
      textStyle: { color },
    },
    grid: {
      left: '3%',
      right: '4%',
      bottom: data.length > 6 ? '20%' : '14%',
      top: '16%',
      containLabel: true,
    },
    tooltip: {
      formatter: '{b}<br/>文章篇数: {c}',
    },
    xAxis: {
      name: '标签',
      type: 'category',
      nameTextStyle: { color },
      axisTick: { show: false },
      axisLabel: {
        show: true,
        color,
        interval: 0,
        rotate: 0,
      },
      axisLine: {
        show: true,
        lineStyle: { color },
      },
      data: data.map(item => item.name),
    },
    yAxis: {
      name: '文章篇数',
      type: 'value',
      splitLine: { show: false },
      nameTextStyle: { color },
      axisTick: { show: false },
      axisLabel: { show: true, color },
      axisLine: {
        show: true,
        lineStyle: { color },
      },
    },
    series: [{
      name: '文章篇数',
      type: 'bar',
      data,
      itemStyle: {
        color: gradient,
      },
      emphasis: {
        itemStyle: {
          color: emphasisGradient,
        },
      },
    }],
  }

  if (data.length > 0) {
    ;(option.series as Array<Record<string, unknown>>)[0].markLine = {
      data: [{
        name: '平均值',
        type: 'average',
        label: { color },
      }],
    }
  }

  return option
}

function renderChart() {
  if (!chartInstance)
    return

  chartInstance.setOption(buildChartOption(), true)
}

async function initChart() {
  if (!chartRef.value)
    return

  try {
    echartsLib = await loadEcharts()
    chartInstance = echartsLib.init(chartRef.value, 'light')
    renderChart()
    chartInstance.resize()

    chartInstance.on('click', 'series', (event) => {
      const data = event.data as TagDataItem | number | undefined
      const tagKey = typeof data === 'object' && data?.tagKey
        ? data.tagKey
        : typeof event.name === 'string'
          ? event.name
          : undefined

      if (tagKey) {
        router.push({
          query: { tag: tagKey },
        })
      }
    })

    stopObserveResize = observeChartResize(chartRef.value, () => {
      chartInstance?.resize()
    })
  }
  catch (error) {
    console.error('[SakuraTagsChart] init failed:', error)
  }
}

watch(chartSignature, renderChart)
watch(textColor, renderChart)
watch(() => props.displayLength, renderChart)

onMounted(() => {
  initChart()
})

onUnmounted(() => {
  stopObserveResize?.()
  chartInstance?.dispose()
  chartInstance = null
  echartsLib = null
})
</script>

<template>
  <div
    id="tags-chart"
    ref="chartRef"
    class="sakura-stat-chart sakura-tags-chart"
    :data-length="displayLength"
  />
</template>

<style lang="scss" scoped>
.sakura-tags-chart {
  display: block;
  height: 360px;
  padding: 10px;
  margin-bottom: 1rem;
}
</style>新增components\layouts\SakuraTagsLayout.vue
<script lang="ts" setup>
import { useConfig, useSiteStore, useTags } from 'valaxy'
import { computed } from 'vue'
import { useI18n } from 'vue-i18n'
import { useRoute, useRouter } from 'vue-router'

type TagsStyle = 'list' | 'chart'

interface TagsPageThemeConfig {
  style?: TagsStyle
  chartLength?: number
}

const route = useRoute()
const router = useRouter()
const site = useSiteStore()
const tags = useTags()
const config = useConfig()
const { t } = useI18n()

const tagStyle = computed(() => {
  const themeConfig = config.value?.themeConfig as { tagsPage?: TagsPageThemeConfig } | undefined
  return themeConfig?.tagsPage?.style ?? 'list'
})

const chartLength = computed(() => {
  const themeConfig = config.value?.themeConfig as { tagsPage?: TagsPageThemeConfig } | undefined
  return themeConfig?.tagsPage?.chartLength ?? 10
})

const curTag = computed(() => route.query.tag as string || '')
const posts = computed(() => {
  const list = site.postList.filter((post) => {
    if (post.tags) {
      if (typeof post.tags === 'string')
        return post.tags === curTag.value
      else
        return post.tags.includes(curTag.value)
    }
    return false
  })
  return list
})

function displayTag(tag: string) {
  router.push({ query: { tag } })
}
</script>

<template>
  <SakuraPage class="sakura-tags-page">
    <RouterView v-slot="{ Component }">
      <component :is="Component">
        <template #main-content>
          <slot name="content">
            <div>
              <div class="sakura-text-light" text="center" p="2">
                {{ t('counter.tags', Array.from(tags).length) }}
              </div>

              <template v-if="tagStyle === 'chart'">
                <SakuraTagsChart :display-length="chartLength" />

                <div class="sakura-tags-list items-end justify-center" flex="~ wrap" gap="1">
                  <SakuraButton
                    v-for="([key, tag]) in Array.from(tags).sort()"
                    :key="key"
                    class="sakura-tag-button"
                    :class="{ clicked: curTag === key.toString() }"
                    @click="displayTag(key.toString())"
                  >
                    <span mx-1 inline-flex>{{ key }}</span>
                    <span inline-flex text="xs">[{{ tag.count }}]</span>
                  </SakuraButton>
                </div>

                <SakuraDivider icon="i-fa6-solid:water" text="文章列表" :divider="false" />
              </template>

              <template v-else>
                <div class="items-end justify-center" flex="~ wrap" gap="1">
                  <SakuraButton
                    v-for="([key, tag]) in Array.from(tags).sort()"
                    :key="key"
                    class="sakura-tag-button"
                    :class="{ clicked: curTag === key.toString() }"
                    @click="displayTag(key.toString())"
                  >
                    <span mx-1 inline-flex>{{ key }}</span>
                    <span inline-flex text="xs">[{{ tag.count }}]</span>
                  </SakuraButton>
                </div>

                <SakuraDivider icon="i-fa6-solid:water" text="文章列表" :divider="false" />
              </template>
            </div>
          </slot>
        </template>

        <template #main-nav-before>
          <slot name="post">
            <div v-if="curTag">
              <SakuraPostList :posts />
            </div>
          </slot>
        </template>
      </component>
    </RouterView>
  </SakuraPage>
</template>

<style lang="scss" scoped>
.sakura-tags-list {
  margin-top: 0.5rem;
  margin-bottom: 0.5rem;
}

.sakura-tag-button {
  color: var(--sakura-tag-color) !important;
  background-color: var(--sakura-tag-bg);
  line-height: 1.75rem;
  transition:
    color 0.3s ease-in-out,
    color-border 0.2s ease-in-out;

  &:hover {
    color: var(--sakura-tag-color, var(--sakura-color-primary)) !important;
    border-color: var(--sakura-tag-color, var(--sakura-color-primary));
  }

  &.clicked {
    color: var(--sakura-tag-color, var(--sakura-color-primary)) !important;
    border-color: var(--sakura-tag-color, var(--sakura-color-primary));
  }

  &::before {
    content: '#';
  }
}
</style>

<style lang="scss">
.sakura-tags-page {
  .sakura-one-columns,
  .sakura-triple-columns {
    width: 100%;
  }

  .sakura-page-content {
    width: 100%;
    max-width: none;
  }

  main {
    width: 100%;
  }
}
</style>
好啦,所有的新增文件部分都已经结束了,但是目前效果还没启动,我们还需要改一下配置文件进行引入才行,接下来跟我一起来操作。
其他文件
这部分文件和上面的不一样哦,也是新增文件,操作和上面还是一样的,该部分一共新增2个文件,加油吧
utils\echarts.ts
import type { ECharts } from 'echarts'

export type EChartsInstance = ECharts
export type EchartsLib = typeof import('echarts')

export function loadEcharts() {
  return import('echarts')
}

export function createGradient(
  echartsLib: Awaited<ReturnType<typeof loadEcharts>>,
  topColor = 'rgba(128, 255, 165)',
  bottomColor = 'rgba(1, 191, 236)',
) {
  return echartsLib.graphic?.LinearGradient
    ? new echartsLib.graphic.LinearGradient(0, 0, 0, 1, [
        { offset: 0, color: topColor },
        { offset: 1, color: bottomColor },
      ])
    : topColor
}

export function observeChartResize(
  el: HTMLElement | undefined,
  onResize: () => void,
) {
  if (!el)
    return () => {}

  let resizeTimer: ReturnType<typeof setTimeout> | undefined

  const scheduleResize = () => {
    clearTimeout(resizeTimer)
    resizeTimer = setTimeout(onResize, 100)
  }

  const observer = typeof ResizeObserver !== 'undefined'
    ? new ResizeObserver(scheduleResize)
    : null

  observer?.observe(el)
  window.addEventListener('resize', scheduleResize)

  return () => {
    observer?.disconnect()
    window.removeEventListener('resize', scheduleResize)
    clearTimeout(resizeTimer)
  }
}
这是下一个文件
styles\index.scss
/* 统计图容器:与文章卡片一致的背景与黑色描边,横向铺满视口并保留边距 */

.sakura-stat-chart {
  --chart-edge: max(20px, env(safe-area-inset-left, 0px));

  box-sizing: border-box;
  width: calc(100vw - 2 * var(--chart-edge));
  max-width: none;
  margin-inline: calc(50% - 50vw + var(--chart-edge));

  border-radius: var(--sakura-post-card-rd, 12px);
  background: var(--sakura-post-card-bg, var(--va-c-bg-soft));
  border: 1px solid rgba(0, 0, 0, 0.85);
}

@media (min-width: 640px) {
  .sakura-stat-chart {
    --chart-edge: max(40px, env(safe-area-inset-left, 0px));
  }
}

html.dark .sakura-stat-chart {
  border-color: var(--sakura-color-divider, rgba(255, 255, 255, 0.2));
}
修改文件
注意哦,这部分的文件不是新建,是在已有基础上修改,这种部分是需要从已有文件进行增加或删除部分代码,因为只占文件的一小部分,所以不适合整个复制
这里解释一下下方写法的意思,当我注明是修改文件时,或者你们根据路径找过去,发现已经有一个同名文件,就说明这是修改类型,下方的文件名和上方的一样,都是路径加文件名的格式,
最常见的文件修改就是valaxy.config.ts,因为这是配置文件,大部分修改都要在里面操作,简单介绍一下这个文件的部分
这是初始状态的文件:
// import type { UserThemeConfig } from 'valaxy-theme-sakura'
import { defineValaxyConfig } from 'valaxy'
// add icons what you will need
const safelist = [
  'i-ri-home-line',
]

/**
 * User Config
 */
export default defineValaxyConfig({
  // site config see site.config.ts

  theme: 'sakura',

  themeConfig: {},

  unocss: { safelist },
})这部分import { defineValaxyConfig } from 'valaxy'是引入部分,后续也会涉及一些引入,跟这一行代码一样,在这一行下方粘贴对应代码即可,例如,当需要新增代码import { demo} from 'demo'代码时,效果就如下方这样:
import { defineValaxyConfig } from 'valaxy'
import { demo} from 'demo'是不是很简单,还有一部分就是themeConfig: {},部分,这部分是主题配置部分,我一般给出的代码格式都是对好的,从下一行的第一个字符直接粘贴即可,这里下面就是一个很好的例子
这里直接写valaxy.config.ts没写路径,不是忘记写了,是此文件在根目录下,打开此文件进行修改,这里我给出的是增加部分代码,有时候我也会连着themeConfig: {},一起给,注意区份哦,我一般会说明的,这里复制下列代码,将其粘贴在themeConfig: {},的{}里面即可。
valaxy.config.ts的themeConfig内增加以下代码
    // 分类页样式:list 列表 / chart 环状图(玫瑰图或旭日图)
    categories: {
      style: 'chart',
    },


    // 归档页样式:list 时间线 / chart 发布统计折线面积图
    archives: {
      style: 'chart',
      startMonth: '2020-01',
    },


    // 标签页样式:list 按钮列表 / chart 柱状统计图
    tagsPage: {
      style: 'chart',
      chartLength: 10,
    },


    tags: {
      rainbow: false,

},下面的代码是加上themeConfig: {},的效果,///...这样的类似符号表示省略代码,因为这部分可以写很多东西,所以加在哪里都行,不过注意格式。
最终效果:
  themeConfig: {
  ///...
    // 分类页样式:list 列表 / chart 环状图(玫瑰图或旭日图)
    categories: {
      style: 'chart',
    },

    // 归档页样式:list 时间线 / chart 发布统计折线面积图
    archives: {
      style: 'chart',
      startMonth: '2020-01',
    },

    // 标签页样式:list 按钮列表 / chart 柱状统计图
    tagsPage: {
      style: 'chart',
      chartLength: 10,
    },

    tags: {
      rainbow: false,
    },
}, 到此所有的修改就都完成了,如果你的终端服务还启动着,直接输入r即可刷新,再次前往浏览器就能看到样式了,如果终端关掉了,cd到项目目录,运行pnpm dev即可开启网页服务。
提一句
页面,就是分类页,归档页那些,不是一开始就有的,需要自己创建,具体位置在pages文件夹内,例如,我要创建一个分类页面,就在pages文件夹内部新建一个名为categories的文件夹(其实文件夹叫什么都可以,英文即可),如何在categories文件夹内部新建一个index.md文件,在文件内写上:
---
layout: categories
title: 分类
icon: i-ri-folder-line
cover: https://你的图床.png
comment: false
---解释一下,layout: categories这个决定了你这是什么页面,这一行代表的就是分类页面,title就是页面标题,icon: i-ri-folder-line这个是图标,cover: https://你的图床.png这个是该页面顶部的头图,comment: false这个是是否开启评论(这个需要另外配置)
这里给出三个页面的index.md文件的内容,上面那个就是分类页面的
下面是标签页面:
---
layout: tags
title: 标签
icon: i-ri-price-tag-3-line
cover: https://你的图床.png
comment: false
---
归档页面:
---
layout: archives
title: 归档
icon: i-ri-archive-line
cover: https://你的图床.png
comment: false
---其他本篇教程不涉及的页面可以看sakura主题文档
好啦,第一篇到此结束咯有用的话打个call吧


- 本文链接: https://daily.yybb.us/posts/valaxy-1/
- 版权声明: 本站所有文章除特别声明外,均采用 CC BY-NC-SA 许可协议。